
Most social teams eventually hit the same wall: impressions drop, engagement crawls, and even your “best” ideas barely make a ripple. In 2025, it’s easy to blame “the algorithm,” but in most cases a dead feed is the result of a system problem you can fix—if you audit it properly.
This guide gives you a forensic, AI‑powered framework to diagnose exactly why your feed went flat and how to revive reach and engagement in the next 30 days, without random experiments or Hail‑Mary trends.
1. Why Your Social Feels Dead (And Why It’s Not Just the Algorithm)
A dead feed usually feels like this:
- You’re posting regularly, but reach is shrinking.
- Engagement is clustered on a few outliers, while most posts flop.
- New formats (Reels/TikToks, carousels) don’t magically fix anything.
- Paid boosts help temporarily, but organic never “recovers.”
Before you blame shadowbans, zoom out and look at the environment you’re publishing into.
Attention is brutally fragmented
Deloitte’s 2023 Digital Media Trends report found U.S. consumers now subscribe to an average of four streaming services and use 3–4 social platforms regularly, fragmenting their time and attention across more feeds than ever before. That makes it significantly harder for any single brand’s content to cut through at scale (Deloitte, 2023).
Combine that with:
- Infinite content supply (short‑form video, creator economy, UGC)
- Smarter feeds tuned to individual behavior, not just follower graphs
- Lower tolerance for generic, promotional brand content
…and you get a world where mediocre posts vanish instantly.
Most feeds die from misalignment, not malice
When a feed goes quiet, it’s usually because:
- Content mix is skewed (too promo, wrong formats, not enough native video).
- Hooks and messages don’t earn attention in the first seconds/lines.
- Audience–content fit is off (you’re posting what you care about, not what they follow you for).
- Cadence and timing are erratic or ignore audience time zones and habits.
- Creative fatigue has set in (same look, same angle, same stories).
- Algorithm signals (watch time, saves, shares, dwell time) are weak.
The good news: each of these is diagnosable and fixable. The rest of this framework shows you how to inspect each “layer” using AI and your own data, then build a focused 30‑day recovery plan.
2. Set the Baseline: Defining “Dead Feed” and Success Metrics
Before changing anything, you need to know whether your feed is actually underperforming—or just normal for 2025.
Rival IQ’s 2024 Social Media Industry Benchmark Report shows just how low “normal” can be:
- Median Instagram engagement rate per post (by followers): 0.43%
- Median Facebook engagement rate per post (by followers): 0.063%
- Median X (Twitter) engagement rate per post (by followers): 0.029%
So if your Instagram posts get a 0.5–0.7% engagement rate by followers, your feed may feel dead but is actually beating the median.
How to define “dead” for your account
Pull the last 60–90 days of data (per platform) and capture:
- Reach per post (and reach as % of followers)
- Engagement rate by impressions (total engagements ÷ impressions)
- Saves / shares per 1,000 impressions
- Video metrics: average watch time, completion rate
- Click‑through rates for link posts
Red flags that indicate a truly “dead” feed:
- Median engagement rate is <50% of your own 6–12‑month historical average.
- Reach as a % of followers has been trending down for 8–12 weeks.
- Very few posts dramatically outperform the median (no “spikes”).
- Video retention curves fall off a cliff in the first 1–3 seconds.
Use AI to summarize your baseline
Export your post data (CSV) and ask an AI tool to:
- Calculate median and top 10% performance for each metric.
- Identify trend lines (e.g., “Engagement rate has declined 35% over 90 days.”).
- Surface outliers (posts that punched above their weight).
Example tasks to give AI:
- “Summarize key trends in this data over the last 90 days.”
- “List the 10 best‑performing posts by engagement rate, and any patterns you see.”
This becomes your “before” picture—crucial when you measure the impact of your 30‑day recovery plan.
3. Step 1 – Content Mix Audit: Are You Posting the Right Types of Content?
A dead feed is often a format problem. Too many static graphics. Not enough native video. No carousels. Every post trying to sell.
HubSpot’s 2023 Social Media Marketing Report found short‑form video to be the highest‑ROI content format for marketers; 90% of marketers using it plan to maintain or increase their investment because of its reach and engagement (HubSpot, 2023).
That doesn’t mean “post Reels and you’re done,” but it does mean your mix needs to reflect how people actually consume content now.
3.1 Classify your current content mix
Export the last 90 days of posts and have AI tag each row by:
-
Format:
- Short‑form video (Reels, TikTok, Shorts)
- Carousel / document
- Single image
- Text‑only (LinkedIn/X)
- Link post
- Live / long‑form video
-
Goal:
- Awareness / reach
- Engagement / community
- Lead gen / click‑through
- Sales / promo
-
Topic or pillar:
- Education / how‑to
- Behind the scenes / culture
- Customer stories / case studies
- Thought leadership / opinions
- Product features / launches
Prompt ideas:
- “For each post, classify the format, goal, and main topic in three new columns.”
- “Group posts by format and compute average engagement rate and reach.”
3.2 Diagnose mix vs. performance
Now look at performance by bucket:
- Which formats drive best engagement per impression?
- Which topics generate most saves and shares, even if reach is low?
- Which formats are you underusing despite strong performance?
You may find, for example:
- Carousels and short videos about “industry myths” have high saves/shares.
- Product promos and link posts drive reach but terrible engagement.
- Text‑only posts on LinkedIn build strong discussion but you only do them 1x/month.
3.3 Make mix decisions for your 30‑day plan
From this audit, define:
- 2–3 priority formats (e.g., Reels, carousels, text posts).
- 3–5 content pillars that clearly resonate (e.g., behind‑the‑scenes, tactical tips, contrarian takes).
- Formats you’ll de‑emphasize (e.g., low‑performing link spam).
In your recovery plan you’ll temporarily over‑index on the formats and topics that your data (not trends) say your audience actually wants.
4. Step 2 – Hook & Message Audit: Diagnosing Scroll-Stopping Power
On every major platform, the algorithm is effectively asking: Did this post earn attention? Your hook—those first few seconds or first line—is what determines the answer.
VidMob’s Creative Signal Report found that videos that clearly hook viewers in the first 3 seconds can drive up to 2–3x more conversions in paid campaigns, primarily via higher completion rates (VidMob, 2022). Organic content follows the same dynamic: weak openings kill watch time and reach.
4.1 Extract and review your hooks
Have AI pull and analyze the opening of each post:
- For video: first frame, first 3 seconds of dialogue, on‑screen text.
- For text/image posts: first line of the caption or post copy.
Ask AI to tag each hook by type:
- Question (“Are you still doing X the hard way?”)
- Bold claim (“We cut our churn in half with one change.”)
- Outcome‑focused (“Get 3 hours back every week with this workflow.”)
- Story (“3 years ago, our marketing team almost got shut down.”)
- Contrarian (“You don’t need more content. You need less.”)
Then request:
- “Score each hook from 1–10 for clarity, curiosity, and specificity.”
- “Highlight hooks that are vague or generic.”
4.2 Compare hooks on winners vs. flops
Next, cross‑reference hook types with performance:
- Which hook types show up most often in your top 10% posts?
- Do your flops often start with:
- Brand intros (“We’re excited to announce…”)
- Vague value (“Some thoughts on marketing…”)
- Context before payoff (“In today’s world of… [ramble]”)
Patterns to watch:
- Top posts usually lead with the payoff or tension.
- Underperformers start with “I” or “we” instead of “you.”
- Strong hooks use specific numbers, timeframes, or outcomes.
4.3 Use AI to upgrade your best ideas
Take your top 20 posts (by engagement per impression) and:
- Ask AI to generate 5–10 new hook variations for each—same idea, different openings.
- Request platform‑specific adaptations:
- “Rewrite this as a 7‑second Reel hook with on‑screen text.”
- “Turn this into a LinkedIn opening sentence that stops the scroll.”
These improved hooks become the backbone of your 30‑day content calendar: same topics that already resonated, just presented with sharper, more platform‑native openings.
5. Step 3 – Audience–Content Fit: Are You Talking to the Right People?
If you’re posting frequently but every metric is sluggish, the fastest fix is rarely “more content.” It’s better fit between what you publish and what your followers want from you.
Sprout Social’s Index, Edition XIX found the top reasons consumers follow brands on social are (Sprout Social, 2023):
- 68% – To learn about new products/services
- 53% – To be entertained
- 51% – To stay up to date on company news
Top turn‑offs:
- 34% – Too much self‑promotion
- 32% – Boring content or lack of personality
5.1 Audit your value mix
Sample 50–100 recent posts and label each as:
- Educational (teaching, how‑to, insights)
- Entertaining (stories, humor, behind‑the‑scenes)
- Promotional (offers, features, pricing, CTAs)
- Credibility (case studies, testimonials, press)
Then ask:
- “What percentage of our posts are primarily promotional?”
- “Which categories correlate with the highest engagement per impression?”
If 60–70% of your content is promo‑first or corporate news, you’ve likely drifted from what your audience actually wants.
5.2 Mine comments and DMs with AI
Export or scrape recent comments and DMs (where possible) and use AI to:
- Cluster common questions and themes.
- Identify recurring pains, objections, and interests.
- Surface phrases people naturally use about your product or category.
Prompt examples:
- “Group these comments into themes and rank them by frequency.”
- “List the top 10 pains or questions our audience mentions, in their own words.”
Compare that to your content pillars:
- Are you answering the questions they actually ask?
- Are you addressing their language and pain, or your internal messaging?
5.3 Tighten your audience definition
Write (and refine with AI) a short doc:
- Who is our primary audience on each platform?
- What job are they hiring our content to do?
(e.g., “Learn specific growth tactics they can use this week.”) - What topics are off‑limits because they drift from that job?
Anchor your 30‑day content plan on that definition. Every post should answer: What is the specific value this delivers to this audience, today?
6. Step 4 – Cadence, Timing, and Consistency: When and How Often You Post
Sometimes reach isn’t bad because your content is weak—it’s because your best posts go out when your audience isn’t there, or your presence is too inconsistent for the algorithm (and your followers) to “trust” you.
Sprout Social’s Best Times to Post on Social Media in 2024 shows that engagement hotspots are highly platform‑ and audience‑specific, even though general patterns (e.g., weekday late mornings) exist. Their main conclusion: there are no universal magic times; the only reliable answer is to test using your own analytics (Sprout Social, 2024).
6.1 Audit your current cadence
For each platform, chart:
- Posts per week over the last 90 days.
- Streaks of silence (e.g., “We didn’t post for 10 days in March.”).
- Correlation between posting bursts and sudden spikes/drops in reach.
Erratic patterns (three posts one week, none the next) often correlate with stalled growth and volatile reach.
6.2 Analyze timing vs. performance
Bucket each post into time windows (e.g., 6–9 a.m., 9 a.m.–12 p.m., etc.) and days of week. Have AI compute:
- Median reach per post by time bucket.
- Median engagement per impression by time bucket.
Ask:
- “Which days and time ranges deliver the highest engagement per impression?”
- “Are there time slots where we post a lot but performance is consistently weak?”
6.3 Set a realistic 30‑day cadence
For your recovery sprint, you don’t need to go from 0 to 10 posts/day. You do need:
- Consistency: same days and windows each week.
- Sufficient volume to get signal (usually 3–5 posts/week per core platform).
- Testing windows: at least 2–3 different time slots to compare.
Example:
- Instagram: 5 posts/week (3 Reels, 2 carousels) in your 2 best time slots.
- LinkedIn: 3 posts/week (2 text + 1 document) during core work hours.
AI can help by taking historical data and suggesting the top 2–3 posting windows where you consistently beat your own median.
7. Step 5 – Creative Fatigue & Repetition: When Your Audience Has Seen It All
Even strong ideas lose their punch when the creative execution never changes.
Meta’s own advertising documentation warns about creative fatigue: when the same creative is shown too often, performance deteriorates as people tune out, leading to lower click‑through and conversions. They explicitly recommend rotating ad creative regularly to combat this decline (Meta Business Help Center).
Organic feeds experience the same thing:
- Same color blocks, same layout, same template.
- Same 3 angles on your product repeated weekly.
- Same stock‑style B‑roll in every vertical video.
7.1 Detect creative fatigue patterns
Use AI to scan post captions, thumbnails, and imagery (where possible) and:
- Group posts that use the same template or angle.
- Identify when performance for a repeated pattern started to drop.
You can also:
- Sort posts chronologically and visually review every 10th post.
- Ask: “If I scroll this grid, does everything blur together?”
Warning signs:
- New posts with nearly identical creative to older winners underperform.
- Audience comments like “You already posted this” or “Seen this before.”
7.2 Refresh without losing your brand
You don’t need to abandon your visual identity to escape fatigue. Instead:
- Vary shot types (talking head, over‑the‑shoulder, screen share).
- Introduce new series concepts (e.g., “60‑second teardown,” “Myth Monday”).
- Repackage old winners into new formats:
- Turn a popular thread into a carousel.
- Turn a carousel into a short video script.
- Turn a long case study into a “before/after” meme.
Use AI to help:
- “Generate 10 new visual concepts for explaining this same idea.”
- “List 5 different series ideas we could build from our best‑performing topics.”
Your 30‑day plan should include creative rotation rules (e.g., no template used more than 2x/week; every topic gets at least two different creative treatments).
8. Step 6 – Algorithm Compatibility: Formats, Signals, and Platform Nuances in 2025
Every major platform has publicly documented what its feed is trying to promote. A dead feed is often just out of alignment with these signals.
Instagram & Reels
Meta’s documentation notes that Instagram ranking heavily weights user interactions—the likelihood that someone will like, comment, share, save, or tap through to your profile—along with time spent on the post. For Reels, completion, re‑watches, likes, comments, and shares strongly influence distribution. Instagram also deprioritizes low‑resolution or watermarked video (Meta Transparency Center – How Instagram Ranking Works).
Audit questions:
- Are you posting original, non‑watermarked Reels?
- What’s your average completion rate and 3‑second view rate?
- Which posts drive saves and profile taps, not just likes?
TikTok (For You)
TikTok explains that For You recommendations are based on:
- User interactions (likes, shares, comments, completions, re‑watches)
- Video information (captions, sounds, hashtags, topics)
- Device and account settings (language, location, etc.)
Completion rate is one of the strongest predictors of distribution (TikTok Newsroom – How TikTok Recommends Videos #ForYou).
Audit questions:
- Do your videos keep people past 3–5 seconds?
- Are you using relevant sounds and hashtags, not just trending ones?
- Are your captions concise, with a clear payoff?
LinkedIn’s engineering blog notes the feed prioritizes:
- Content from people you know and follow
- Relevance to your profile, behavior, and groups
- Dwell time (how long you pause and read)
In 2023, they shifted to favor knowledgeable, expert‑driven posts over engagement bait (LinkedIn Engineering Blog, 2023).
Audit questions:
- Are your posts substantive (teaching, showing work) vs. pure hooks?
- Do you encourage thoughtful comments, not one‑word replies?
- Are employees and advocates engaging soon after posting?
X (Twitter)
X’s open‑sourced recommendation algorithm shows heavy weighting for likes, retweets, and replies, and downranking for spam or content flagged by safety systems (X / Twitter “the-algorithm” on GitHub).
Audit questions:
- Do your posts invite quote tweets and replies, or just impressions?
- Are you avoiding spammy patterns (hashtag stuffing, repetitive CTAs)?
- Are you participating in conversations, not just broadcasting links?
9. Using AI to Run the Forensic Audit: Practical Workflows and Prompts
At this point, you know what you should audit. AI is how you do it fast—especially if you manage multiple platforms and hundreds of posts.
McKinsey’s State of AI in 2023 found that marketing and sales are among the top three business functions using AI, and 79% of organizations using AI report it has already increased revenue in at least one area (McKinsey, 2023).
Here’s how to plug that power into your social audit.
9.1 Data prep (once per platform)
- Export 60–90 days of posts into CSV:
- Date/time, caption, link, format, impressions, reach, likes, comments, shares, saves, clicks, watch time, completion, etc.
- If possible, export comments as a separate CSV.
9.2 Core AI workflows
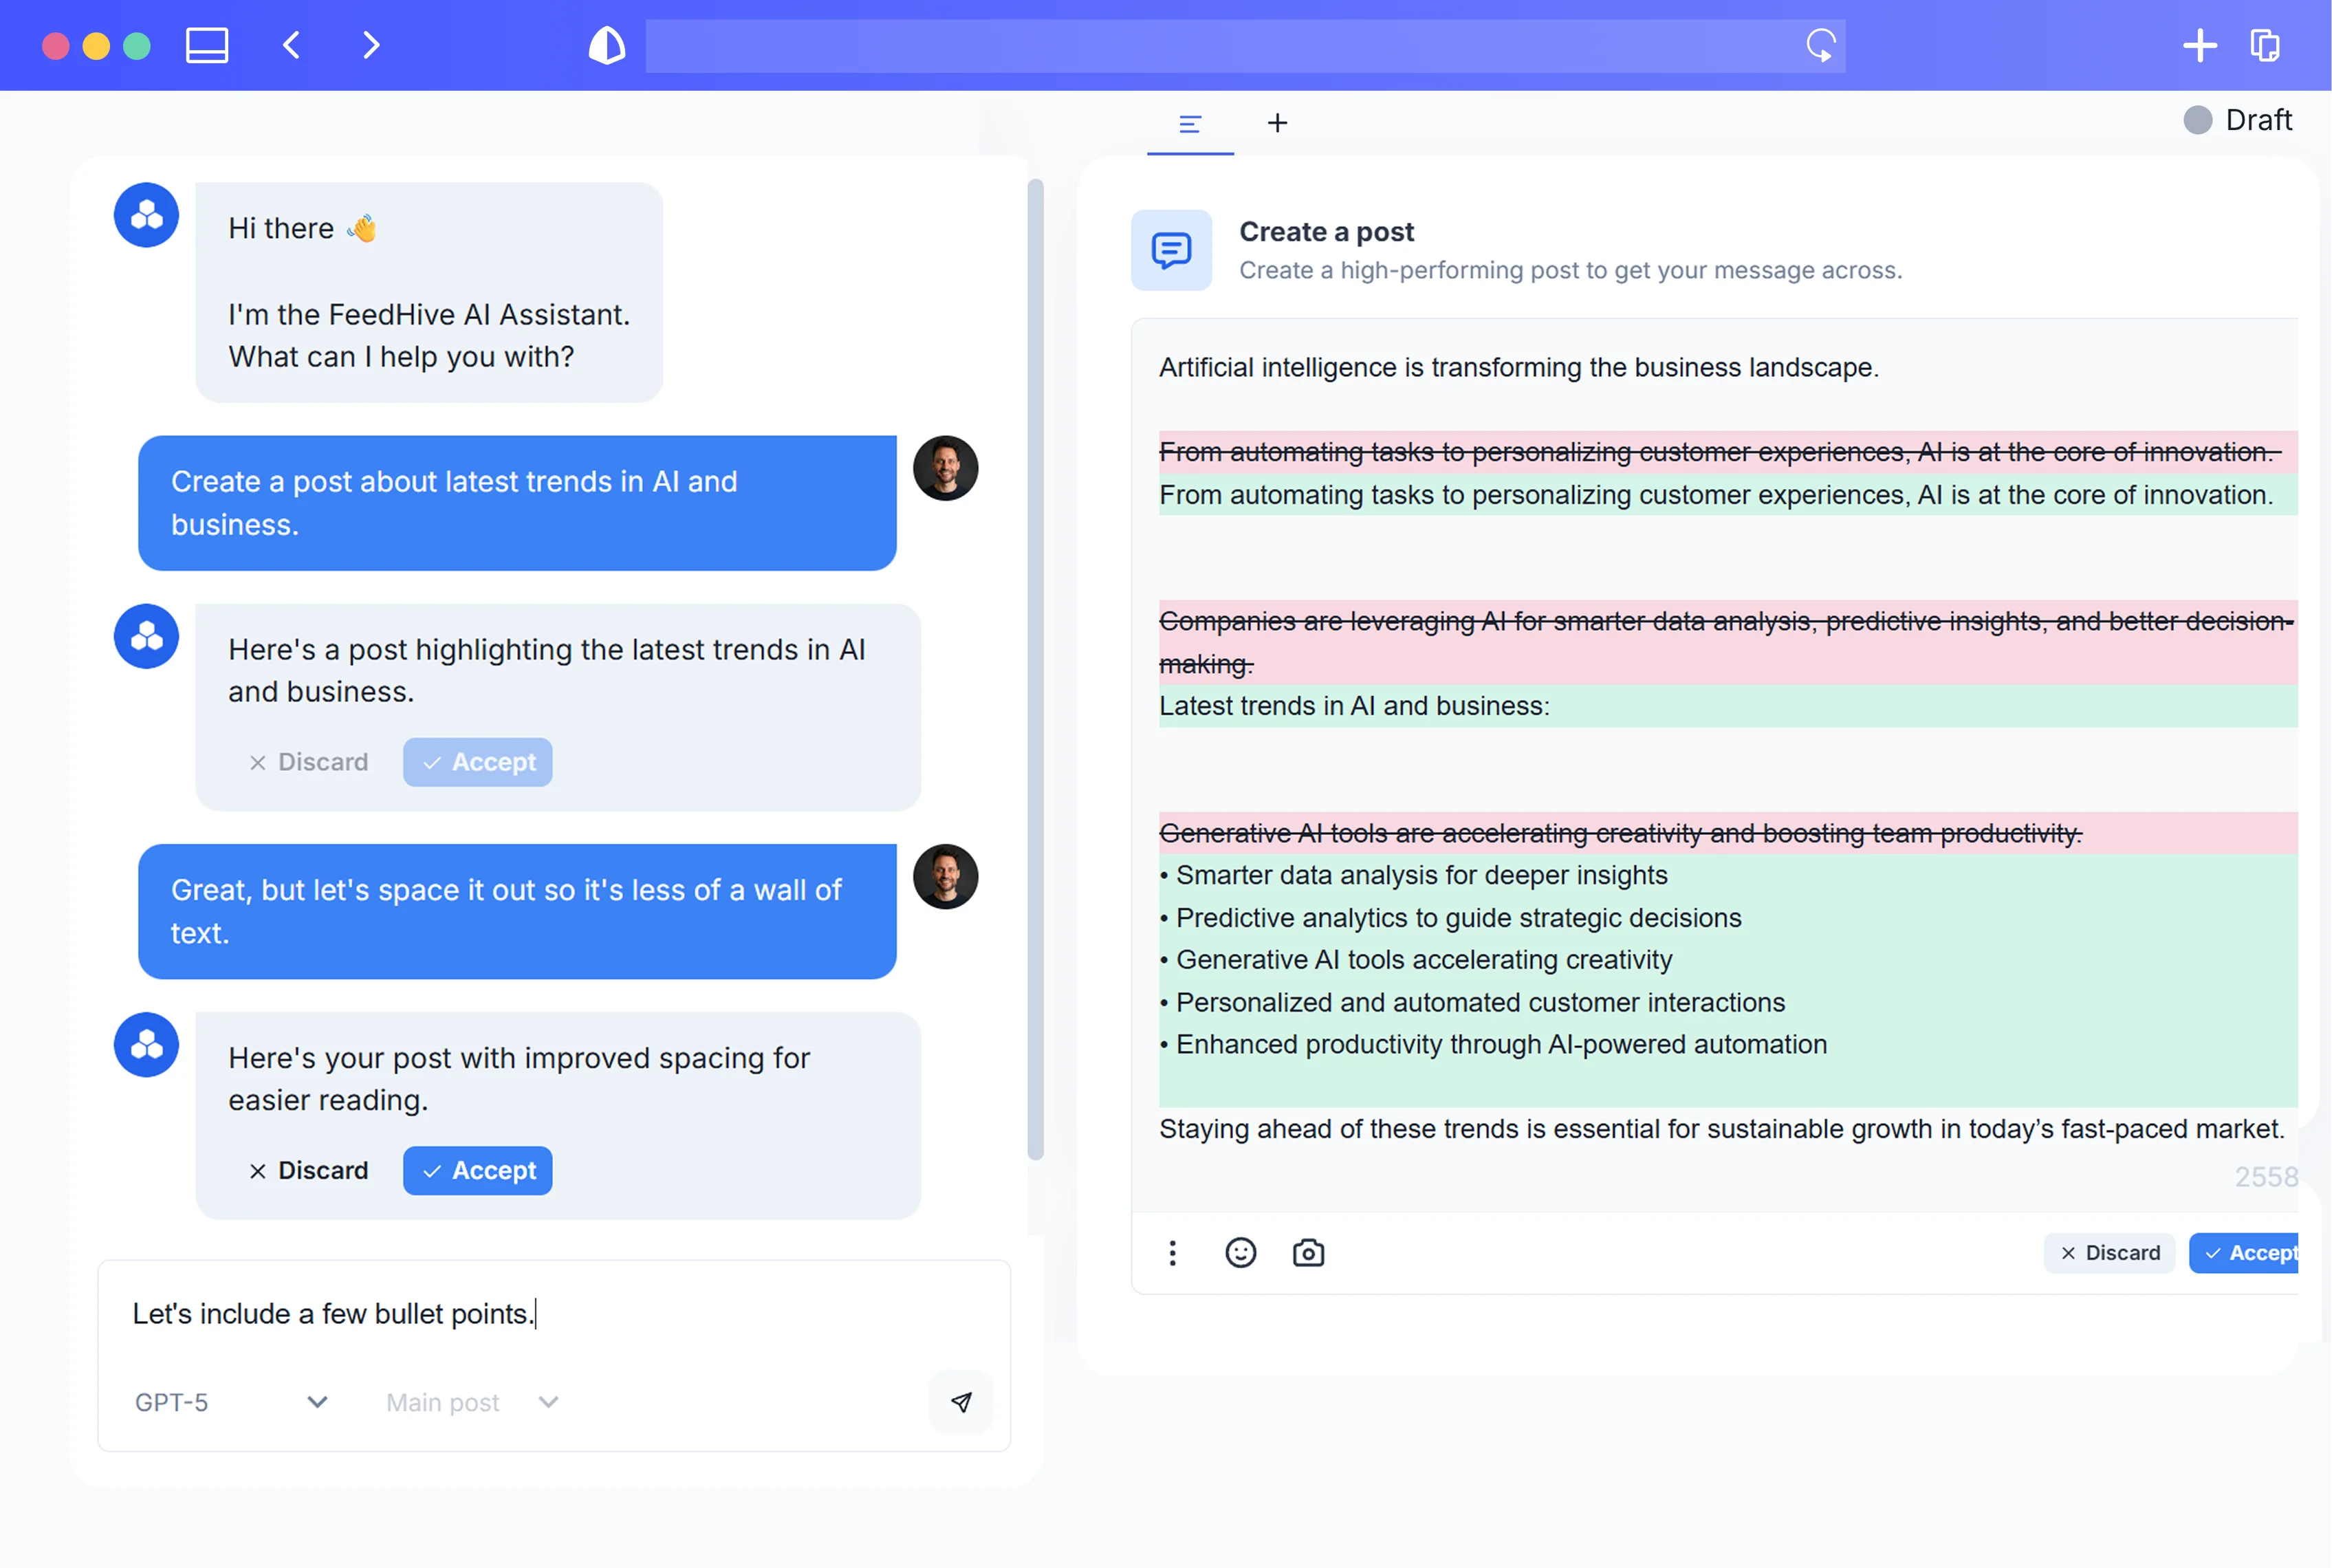
Use a general‑purpose AI model or a social tool with built‑in AI analytics (like FeedHive) to run workflows such as:
1. Performance clustering
- Task: “Group posts into clusters based on similar topics and formats. For each cluster, calculate average engagement per impression and reach.”
- Outcome: See which themes and formats consistently outperform.
2. Hook analysis
- Task: “Extract the first sentence or first 10 words of each caption, label the hook type, and score it for clarity and curiosity.”
- Outcome: Understand which hook styles work for your audience.
3. Timing & cadence insight
- Task: “Bucket posts into 3‑hour time windows and days of week. For each bucket, calculate median engagement per impression and reach.”
- Outcome: Identify best (and worst) posting windows for your account.
4. Audience language mining
- Task: “From these comments, extract the top 20 recurring pains or questions. Quote them verbatim and summarize them in plain language.”
- Outcome: A prioritized list of audience needs to shape content.
5. Idea generation from winners
- Task: “From the top 10% of posts by engagement rate, generate 10 new content ideas and hooks that build on these same angles.”
- Outcome: A backlog of high‑probability content ideas for your recovery plan.
Advanced AI‑powered tools such as FeedHive can automate parts of this—analyzing your historical posts, surfacing best‑performing themes, and suggesting content and posting times based on what’s actually worked for you.
10. Designing a 30‑Day Recovery Plan from Your Audit Findings
With your audit done, you now have:
- Clear baseline metrics
- A prioritized content mix
- Improved hooks and messages
- Sharper audience understanding
- Optimized cadence and timing
- A list of creative refresh ideas
Your 30‑day plan is about executing fewer, sharper bets with enough volume to give the algorithm new, positive signals.
Later’s blog has shared multiple case studies where brands saw reach grow 2–5x within 30–60 days after tightening their niche, focusing on short‑form video, and posting consistently (Later Blog). That’s the kind of shift you’re aiming for—on your own terms.
Week 1: Reset and relaunch
Goals:
- Implement new cadence and time slots.
- Launch refreshed creative and hooks.
- Stop publishing obvious underperformers.
Actions:
- Lock in your content pillars and priority formats.
- Create 10–20 posts in advance using your new hook variations.
- Update templates: new layouts, new series concepts, distinct visuals.
- Start posting on your new schedule (e.g., 4–5 posts/week per core platform).
Week 2: Double down on resonance
Goals:
- Identify early winners; kill clear losers quickly.
- Increase focus on topics and formats that spike engagement per impression.
Actions:
- At week’s end, use AI to:
- Compare the first two weeks’ posts against your baseline.
- Identify posts with high engagement per impression (even if reach is modest).
- Spin out derivatives of winners:
- Turn a strong post into multiple new formats.
- Extend into a mini‑series.
- Reduce output of any format or pillar that’s clearly underperforming.
Week 3: Refine for signals the algorithm cares about
Goals:
- Boost saves, shares, completion, and dwell time.
- Nudge more people into meaningful interactions.
Actions:
- Introduce stronger CTAs aimed at saves and shares:
- “Save this for later.”
- “Share this with a teammate who needs it.”
- For video:
- Tighten first 3 seconds again based on retention data.
- Add clearer on‑screen instructions and captions.
- For LinkedIn/text posts:
- Lead with a specific claim and follow with a short story or breakdown.
- Ask one open‑ended, thoughtful question to invite comments.
Use AI to:
- Rewrite underperforming captions to emphasize benefits and specificity.
- Suggest alternative CTAs for posts that got views but few interactions.
Week 4: Systematize and plan the next 90 days
Goals:
- Decide what becomes your new normal.
- Turn your learnings into a repeatable system.
Actions:
- Compare 30‑day performance to your baseline:
- Reach per post
- Engagement per impression
- Follower growth
- Video completion rates
- Document what worked:
- Top 3 formats
- Top 5 topics
- Best posting windows
- Hook types that consistently win
- Build a 90‑day content roadmap:
- Weekly posting schedule
- Recurring series (e.g., “Customer Story Friday”)
- Monthly creative refresh checkpoints
This 30‑day sprint is the proof of concept. Your goal isn’t perfection—it’s to create a clear, data‑backed direction for the next quarter.
11. Case Study: Turning Around a Flat B2B Feed in One Month
This is a composite example based on real B2B patterns.
The situation
- Platform: LinkedIn company page + founder’s personal profile
- Audience: ~7,000 followers (SaaS leaders, RevOps, demand gen)
- Baseline (last 90 days):
- Median engagement rate: 0.2% on company page, 0.5% on founder
- Posts: mix of product updates, press releases, blog links
- Cadence: bursts of 4–5 posts in a week, then silence for 2–3 weeks
Leadership’s perception: “LinkedIn doesn’t work for us anymore.”
The audit
Content mix:
- 60% product‑centric posts
- 30% company news
- 10% educational content
Winner posts (by engagement per impression):
- A rare, detailed thread by the founder breaking down a failed experiment.
- A carousel titled “5 dashboards your CRO actually checks.”
Hooks & message:
- Most posts started with:
- “We’re excited to announce…”
- “New on the blog…”
- Strongest posts started with specific, painful situations:
- “If your sales team ignores your dashboards, this is probably why.”
Audience–content fit:
- Comment analysis showed recurring pains:
- Hard to get sales to adopt tools
- Pressure to show marketing’s impact on pipeline
- Very few posts directly addressed these pains.
Cadence & timing:
- Posting mostly in the founder’s late evening.
- Best‑performing posts historically went out mid‑morning on weekdays.
Creative fatigue:
- Same style of promo image on almost every post.
- Carousels and text‑only posts were rare but over‑performed.
Algorithm compatibility (LinkedIn):
- Posts were link‑heavy, pushing readers off‑platform.
- Few posts invited comments or conversation.
The 30‑day plan
Week 1–2:
- Shift to 3 posts/week on both founder and company, in core working hours.
- 70% educational/problem‑solving, 20% stories, 10% product.
- Launch 2 recurring series:
- “Dashboard Makeover” (carousel)
- “RevOps Therapy Session” (founder text posts)
Week 3–4:
- Use AI to:
- Expand top‑performing topics into multiple angles.
- Improve hooks on carousels and text posts.
- Introduce clear CTAs for comments:
- “Reply ‘DASHBOARD’ if you want the template.”
- “What’s the one metric your CRO actually opens?”
The outcome (directional)
After 30 days:
- Median engagement rate on founder posts: 2–3x baseline.
- 2 posts went modestly viral in their niche (10–15x median impressions).
- Company page saw:
- More comments from true ICPs (CROs, RevOps leads)
- Higher profile visits and demo page traffic, even with fewer link posts.
The key: nothing magical—just sharp alignment of topics, hooks, format, and timing to what the audience already cared about, discovered via a structured audit.
12. Common Pitfalls When Reviving a Dead Feed (And How to Avoid Them)
As you run your 30‑day sprint, watch out for these traps.
1. Changing everything at once
If you overhaul platform, brand, cadence, and content mix simultaneously, you won’t know what caused improvements.
Fix: Change in layers:
- Week 1: cadence + timing + hooks
- Week 2: creative + formats
- Week 3: CTAs and interaction strategy
2. Chasing trends instead of your data
Lip‑syncing to a trending audio won’t save a feed if the topic isn’t what your audience wants.
Fix: Use trends as skins on proven topics, not as strategy.
3. Over‑posting low‑value content
Hootsuite’s Social Trends 2024 report found marketers who focus on fewer, higher‑quality posts tailored to specific audience segments are more likely to report strong ROI than those who post “as often as possible.” Yet only 34% have a documented social strategy aligned to customer segments (Hootsuite, 2024).
Fix: Stick to your pillars. If an idea doesn’t clearly serve your primary audience, skip it.
4. Letting AI erase your voice
If you copy‑paste generic AI captions, your feed will sound like everyone else’s—and audiences will tune out.
Fix:
- Feed AI your brand voice guidelines and examples.
- Treat AI as a first draft or brainstorming partner, not the final word.
- Always add a human pass: personal story, specific example, real numbers.
5. Ignoring replies, DMs, and comment threads
Algorithms reward relationship signals. If you only publish and never interact, you miss half the game.
Fix:
- Block 15–30 minutes after each post to:
- Reply thoughtfully to comments.
- Engage with your audience’s content.
- Answer DMs that could inspire future posts.
13. When to Pivot Channels vs. Double Down: Making a Strategic Call
Sometimes, despite your best efforts, a channel remains stubbornly flat. How do you know whether to keep pushing or pivot?
Buffer’s State of Social Media 2023 report notes that accounts posting consistently (not necessarily frequently) see better sustained growth in reach and followers than those who post in bursts and then go silent (Buffer, 2023). Consistency over months, not weeks, is what reveals a channel’s real potential.
Signs you should double down on a channel
- You see pockets of strong engagement (some posts outperform massively).
- Your ICP is clearly active on the platform (you see peers and customers).
- After 30–60 days of consistent execution, your trend line is up and to the right, even if slowly.
Signs it may be time to pivot
- You’ve executed a disciplined strategy for 90+ days and:
- Engagement is stagnant or declining.
- No content type or topic visibly breaks out.
- Your ICP has migrated elsewhere (e.g., from Facebook to TikTok/LinkedIn).
- Your format strengths (e.g., long‑form writing) are fundamentally mismatched with the platform’s dominant behavior.
Smart pivot moves
- Shift from a company account focus to a founder/employee‑led strategy (especially on LinkedIn and X).
- Reduce posting frequency on the weak channel while increasing repurposed, adapted content from stronger channels.
- Use the “weak” platform more for retargeting and ads than organic discovery.
The audit gives you the evidence to make this call without guesswork.
14. Checklist & Template: Your Repeatable AI-Powered Social Audit Framework
Gartner predicts that by 2025, roughly 80% of marketing leaders will integrate generative AI into daily workflows, including content ideation, copywriting, and performance analysis (Gartner, 2023). Turning your audit into a repeatable, AI‑assisted process puts you ahead of that curve.
Use this checklist every quarter:
Baseline
- [ ] Export 60–90 days of data per platform.
- [ ] Calculate median and top 10% performance for:
- Reach per post
- Engagement per impression
- Saves, shares, clicks
- Watch time and completion (video)
Content mix
- [ ] Classify posts by format, goal, and topic.
- [ ] Identify formats and topics with highest engagement per impression.
- [ ] Decide which formats to emphasize and de‑emphasize.
Hooks & messaging
- [ ] Extract and label hooks by type.
- [ ] Compare hook patterns on winners vs. flops.
- [ ] Generate improved hook variations for top topics.
Audience–content fit
- [ ] Label posts by value type (educational, entertaining, promotional, credibility).
- [ ] Analyze comments/DMs to surface top pains and questions.
- [ ] Tighten audience definition and content “job to be done.”
Cadence & timing
- [ ] Chart posting frequency and gaps.
- [ ] Analyze engagement and reach by day/time.
- [ ] Set a realistic, consistent 30–90‑day posting schedule.
Creative fatigue
- [ ] Identify overused templates and angles.
- [ ] Plan new series and visual treatments for core topics.
- [ ] Define creative rotation rules (e.g., no template >2x/week).
Algorithm alignment
- [ ] For each platform, review:
- Key engagement signals (completion, dwell, saves, shares, replies).
- Any practices that might cause downranking (watermarks, clickbait).
- [ ] Adjust formats and CTAs accordingly.
AI workflows
- [ ] Use AI (or a platform like FeedHive) to:
- Cluster posts and analyze performance patterns.
- Summarize trends and outliers.
- Generate content ideas and improved hooks.
- [ ] Document prompts and workflows that worked well.
Run this audit, then design a 30‑day recovery sprint that makes a few big, smart bets—rather than hundreds of random ones.
Conclusion
A dead social feed isn’t a mystery; it’s a collection of fixable misalignments:
- Between your content mix and how people consume now.
- Between your hooks and how fast they scroll.
- Between your topics and what your audience actually cares about.
- Between your cadence and when they’re online.
- Between your creative and what the algorithm is built to surface.
By combining your own performance data with an AI‑powered forensic audit, you can diagnose those gaps quickly, then execute a focused 30‑day plan that gives the algorithm—and your audience—new reasons to care.
Do this once, and you’ll revive a flat feed. Turn it into a repeatable system, and you’ll build a social presence that compounds instead of constantly needing resuscitation.